We presented “SPDO: High-Throughput Road Distance Computations on Spark Using Distance Oracles” in ICDE 2016, held in Helsinki, Finland. It is a framework which implements an extremely fast distributed algorithm for computing road network distance queries on Apache Spark. The approach extends our previous work of developing the ε-distance oracle which has now been adapted to use Spark’s resilient distributed dataset (RDD). Compared with state-of-the-art methods that focus on reducing latency, the proposed framework improves the throughput by at least an order of magnitude, which makes the approach suitable for applications that need to compute thousands to millions of network distances per second.
Job Accessibility:
State Smart Transportation Initiative (SSTI) tried to define the road network accessibility based on “opportunities” and “travel time”. For example, a good accessibility metric for jobs is how many jobs can be accessed within X minutes by bus/transit/auto? Based on this metric, we then can draw an accessibility intensity distribution. A detailed illustration is provided by SSTI in the youtube video.
In our example, we are computing the average commute distance in kilometers for residents of California as in the following figure. This query is of immense interest of transportation planners and was computed using the LEHD data from the US Census Bureau by performing 13,645,807 road network distance computations.
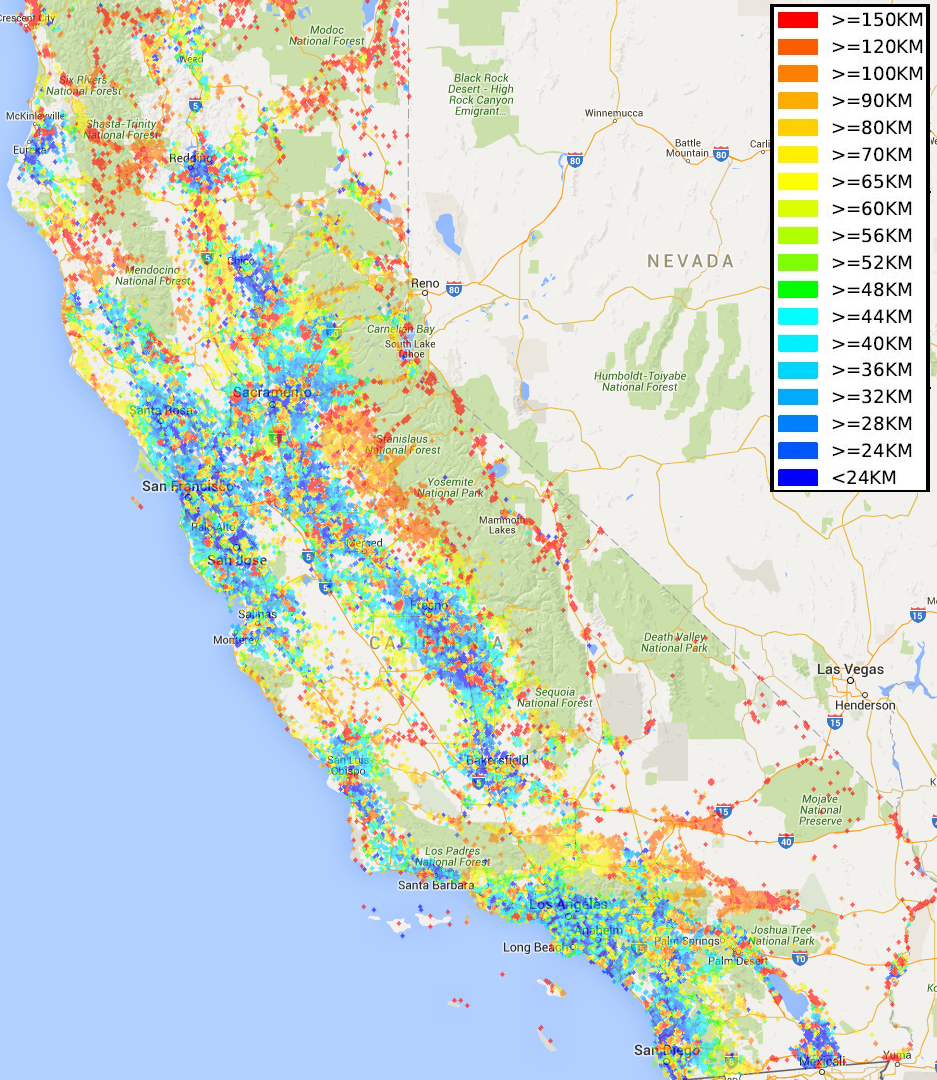
Geographical heat map for the average drive distance from living place to workplace for people in California: a pixel’s color in this figure denotes the average drive distance of people residing in the pixel’s region. The query workload is 13,645,807 shortest distance computations, and our distributed key-value method on a Spark cluster with 5 task machines took 13 seconds. In contrast, state-of-the-art methods, e.g., Contraction Hierarchies, running on the same 5 machines in parallel, needed more than 20 minutes.
Route Directness Spectrum:

Route directness spectrum (RDS) of New York City (NYC), the Bay Area (Bay), and Salt Lake City (SLC). In contrast, the average route directness index, corresponding to the average ratio of network distance to geodesic distance, is 1.213 for NYC, 1.384 for Bay Area, 1.475 for SLC; and the maximum route directness index, corresponding to the maximum ratio of network distance to geodesic distance, is 10.6 for NYC, 30.4 for Bay, and 26.3 for SLC.
One way of computing the route directness spectrum of a road network is to impose a grid on the road network. We compute the ratio of the network distance between the centroids of two grid cells to its geodesic distance and weight it by the product of the number of vertices in each grid cell. The above figure was produced by bucketing and counting up all values of the route directness index located in [x, x + 0.1), where x is a point on the x-axis. For each bucket, we compute the percentage of each group as a percentage of the total number of shortest paths. Note that the route directness index must be larger than 1.0 since geodesic distance is always less than or equal to the network distance. As the values of the maximum route directness index that we found were 10.6, 30.4, and 26.3 for NYC, Bay, and SLC, respectively, solely using the maximum route directness index is not a good way to measure the connectivity of a road network. On the other hand, average route directness index may be fair enough, but its computation workload is the same as the route directness spectrum.
It is important to note that using our distributed key-value methods, the computing the route directness spectrum for a moderate-sized region such as NYC can be completed within 1 minute, while other methods complete it in a reasonable time (e.g., more than 4 hours using Contraction Hierarchies, since there is a very large number of distance computations to be performed).
